Guitar Building, Audio Effects, and DIY Resources
From Our Shop
DIY Resources
Company Info
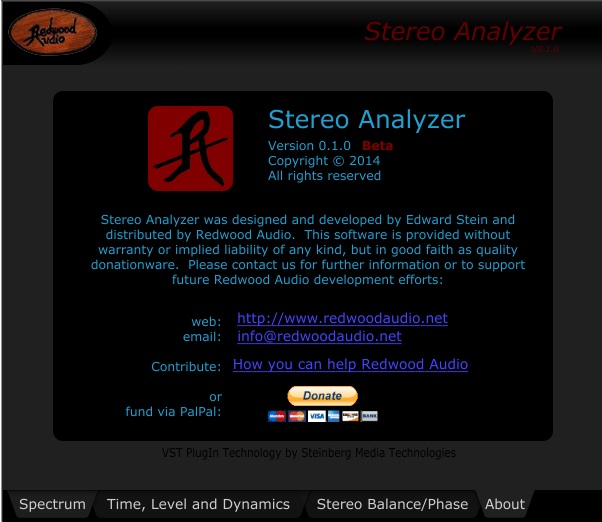
Redwood Audio - Stereo Analyzer Plugin
Stereo Illuminated!
The Redwood Audio Stereo Analyzer is the first plugin in a series of tools provided as donationware. They are free to download and use, but not for redistribution. If you like what you find, consider some token appreciation, using the in-app donation button, or tell a friend - but please share only links to this page.
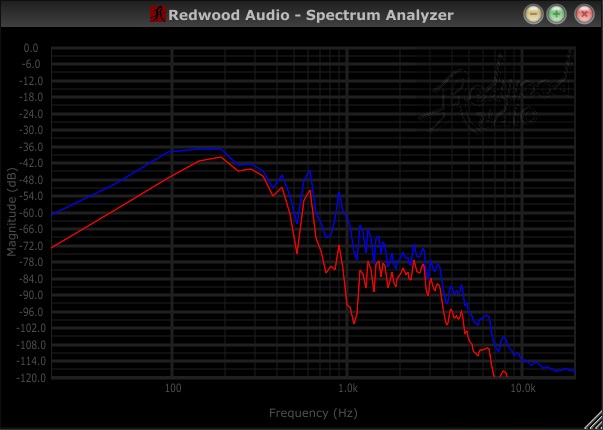
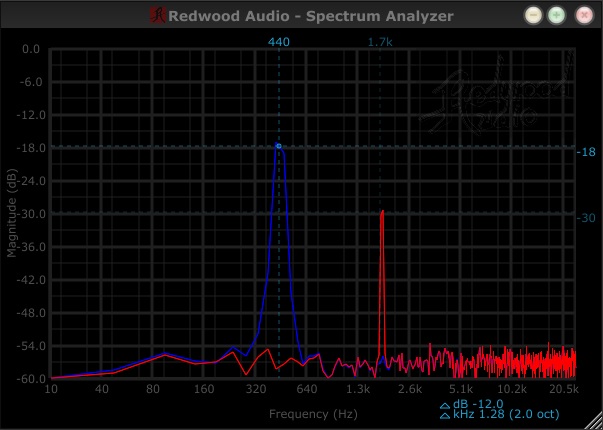
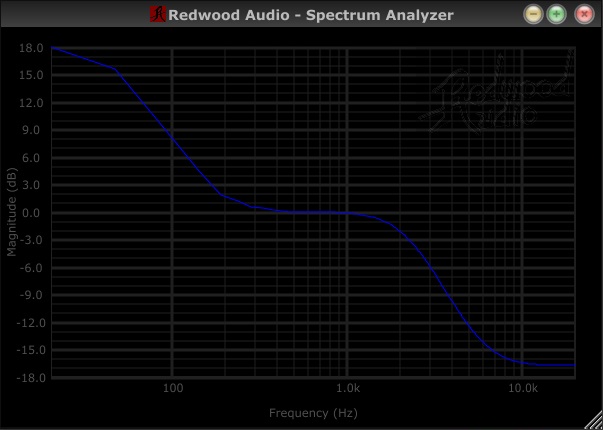
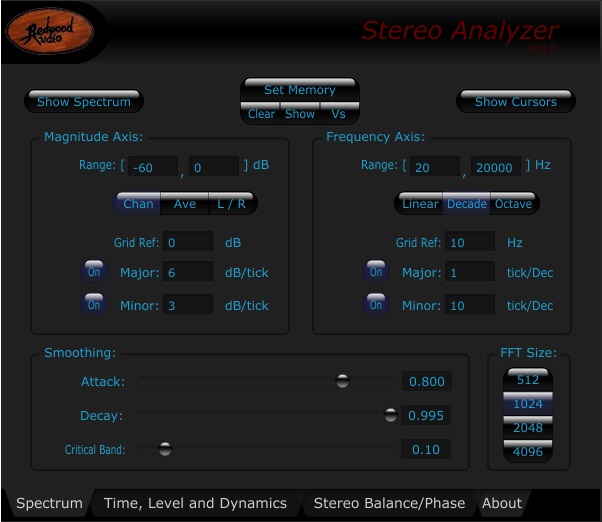
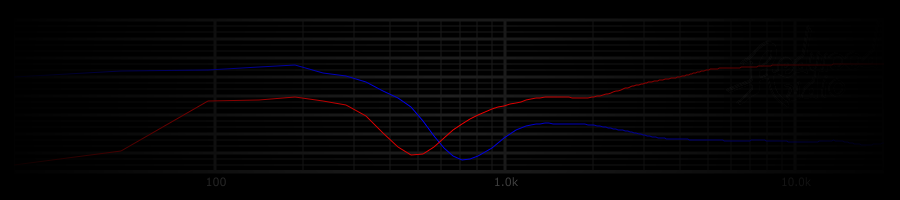
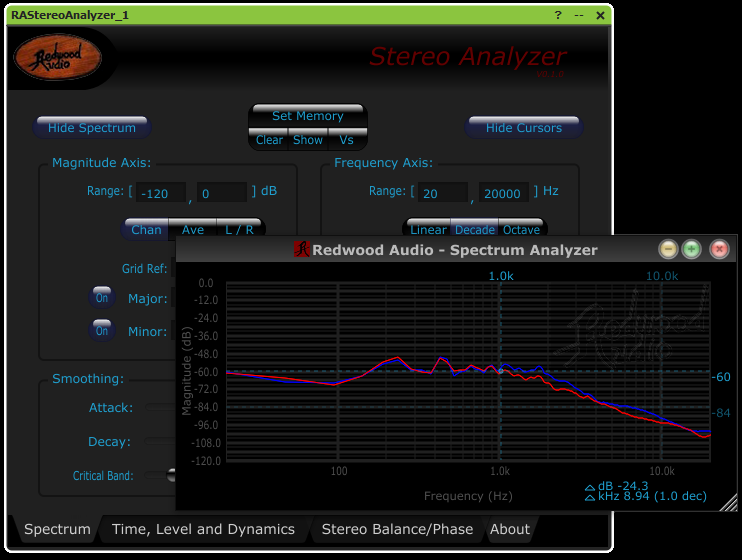
The initial beta release includes a stereo spectrum analyzer designed with audio developers in mind. Many such spectrum tools have limited display options and don't offer relative modes that are critical for debugging your audio plugins or projects. These modes allow you to directly view filter/EQ responses and measure spectrum differences - all from a resizable floating plot window with mouse zooming and measurement cursors. The main analyzer window offers direct control over plot parameters, grids and smoothing options as well as the memory settings and ability to freeze the plot (using the Redwood Audio Logo).
If you have feedback, would like to see builds for other platforms or be notified when the additional plots are included in future builds, please contact us.
Current Release:
Beta 1.0 - Win VST 2.x - download here
Software Specs/Features:
Spectrum Analyzer: |
Real-time plotting of Stereo Channels, Stereo Average or L/R Relative spectrum - direct or relative to memory. Selectable FFT size with Attack/Release/Critical Band Smoothing Controls. Custom Grids and Frequency Scale (Linear, Decade or Octave) |
Platforms: |
Windows: VST 2 OSX: None for Beta 1.0 |